
The Game That Heated My iPhone: Godot Mobile Performance
10 min read
Kalecik is a calm castle and village builder I made with Godot 4: you draw lines with your finger and they turn into stone walls, houses and bridges. While testing the first builds on my iPhone 15 Pro Max, I noticed something off. While I played, the phone was clearly getting hot in my hand. The screen showed a meadow, a few sheep and some stone walls, not an action game. Heat like that had to have a cause.
This post is about that cause and the fixes that followed: a display running at 120 Hz, a frame-rate governor, shadow proxies, chunked grass, building meshes on worker threads, and one idea we tried and threw away. The bigger story, how the game was built with five parallel Claude Code sessions, is in the series hub post.
Two things up front. First, Claude Code agents wrote the code in this project. I noticed the heat and reported it, opened a separate session for performance, made the calls and tested every build on the phone. Second, every millisecond figure in this post was measured on an M1 Mac. I have no temperature or fps numbers measured on the phone, so you will not find a sentence like "the phone got X degrees cooler" here.
Measure first, even when Metal says zero
The performance session started with measurement, not guesses. scripts/perf.gd adds two tools:
- An on-device log. Debug builds append one line per second to
user://perf.csv: fps, the current frame cap, the longest frame, CPU and GPU time, draw calls and primitives. On iOS the file lands in the app's Documents folder, andxcrun devicectlcan copy it to the Mac. - An A/B bench. Launched with
-- --bench, the game leaves the loaded village alone and toggles render settings one at a time (glow off, shadow filter 1 and 0, a 1024 shadow atlas, a single shadow split, 0.7 render scale, MSAA off, no grass, no shadows), then writes the average frame time for each case.
The first surprise came right away: Godot's Metal driver reported viewport GPU time as 0. With the default driver on the Mac, there was no way to see how hard the GPU was working. The agent's workaround was to run the same scene through Vulkan, which on macOS means MoltenVK:
# Metal reports 0 for GPU time, so measurements were taken through Vulkan (MoltenVK)
godot --path . --rendering-driver vulkan --rendering-method mobile -- --bench
A caveat: on the M1 the same measurement moves around noticeably from run to run, so we only trusted large differences, not small ones.
The root cause: the game was running at 120 fps
The real finding was not in the render settings but in the export settings. Godot's iOS export writes CADisableMinimumFrameDurationOnPhone = true into Info.plist. That key allows an iPhone app to go above 60 Hz. On top of that, Godot's display/window/ios/allow_high_refresh_rate setting defaults to true. Put together, on the ProMotion display of the iPhone 15 Pro Max the game was drawing 120 frames per second.
For a cozy village game, that means redrawing a mostly unchanging scene twice as often as needed. The fix is one line in project.godot:
[display]

window/ios/allow_high_refresh_rate=false
Godot reads this only at startup, so there is no switching back to 120 while the game runs. That is fine for us; we do not want to.
The lesson I took from it: when you build on an engine or a template, review the export defaults once. The root cause of the heat was not in the game code at all. It was a plist key and a default setting nobody had looked at.
A frame-rate governor: 60, 30, 10
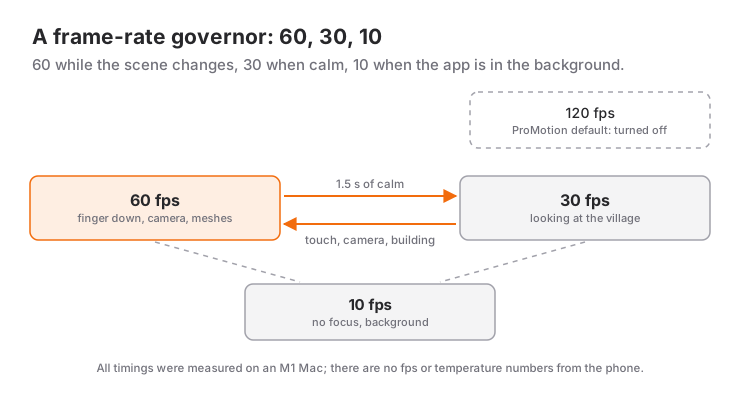
Even 60 fps is not always needed. When the player lifts a finger and just looks at the village, walking sheep and waving grass look the same at 30 fps. So perf.gd includes a small governor:
const FPS_ACTIVE := 60
const FPS_IDLE := 30
const FPS_AWAY := 10     # app in the background or out of focus
const IDLE_S := 1.5      # drop to 30 after this many calm seconds

var _calm := 0.0
var _away := false

func _cap(fps: int) -> void:
    if Engine.max_fps != fps:
        Engine.max_fps = fps

## Is a finger down, is the camera gliding, are meshes being built in the background?
func _busy() -> bool:
    if not (game.touches as Dictionary).is_empty():
        return true
    if game.view != null and game.view.busy():
        return true
    return game.rig != null and game.rig.moving()

func _input(_ev: InputEvent) -> void:
    _calm = 0.0
    if not _away:
        _cap(FPS_ACTIVE)   # the first touch brings full speed back immediately

func _notification(what: int) -> void:
    match what:
        NOTIFICATION_APPLICATION_FOCUS_OUT, NOTIFICATION_APPLICATION_PAUSED:
            _away = true
            _cap(FPS_AWAY)
        NOTIFICATION_APPLICATION_FOCUS_IN, NOTIFICATION_APPLICATION_RESUMED:
            _away = false
            _calm = 0.0

func _process(delta: float) -> void:
    if _away:
        return
    _calm = 0.0 if _busy() else _calm + delta
    _cap(FPS_ACTIVE if _calm < IDLE_S else FPS_IDLE)
The part that matters is getting "busy" right. Watching touches alone is not enough: if the camera keeps gliding after the finger lifts, or a large wall is still being built in the background, you still need 60 fps or the motion stutters. The governor is off in automated tests, which want an uncapped frame rate.
Shadows: detailed stones should not cast them
Before the fix, shadows took roughly 32% of GPU time and grass about 24% (M1, MoltenVK). Shadows were that expensive because the wall meshes are very detailed: hundreds of stones per meter plus ivy leaves. When the sun's shadow map was drawn, all those stones were drawn a second time, even though a shadow only needs the silhouette.
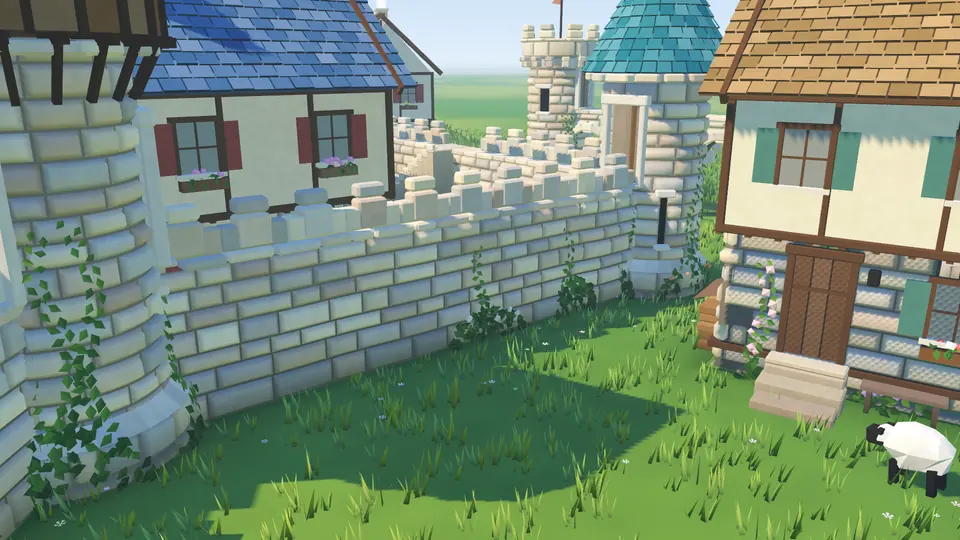
Up close every stone shows; the shadow comes from a plain stand-in.
The agent's answer was shadow proxies. Every wall chunk, tower and house gets a plain companion shape (two faces and a top, merlons as simple boxes, gate arches left open). The detailed mesh stays out of the shadow pass entirely and the plain shape casts the shadow:
## The visible mesh casts no shadow; a silhouette-only stand-in does.
func _pair(mesh: Mesh, shadow: Mesh) -> Node3D:
    var n := Node3D.new()
    var mi := MeshInstance3D.new()
    mi.mesh = mesh
    mi.cast_shadow = GeometryInstance3D.SHADOW_CASTING_SETTING_OFF
    n.add_child(mi)
    var sh := MeshInstance3D.new()
    sh.mesh = shadow
    sh.cast_shadow = GeometryInstance3D.SHADOW_CASTING_SETTING_SHADOWS_ONLY
    n.add_child(sh)
    return n
The result: shadow primitives went from 164k to 31k, and GPU time in the far view dropped from 4.57 ms to 3.81 ms. As the comment in the code puts it, only the silhouette matters for a shadow, not every bump of every stone.
Two more settings changed in the same pass. Glow is now on only when windows are lit, which mostly means evening and night, so it no longer runs for nothing during the day. After the A/B bench, the shadow filter quality went from 2 to 1, while MSAA 2x and the 0.8 render scale stayed as they were to keep the look intact.
The sky turned out to be a hidden cost too. Every write to a ProceduralSkyMaterial color re-renders the radiance map that lights the scene, even if you write the same value. During sunsets and when rain starts, that happened every frame. At the default size of 256 pixels it cost +1.4 ms. The size is now 64 pixels (+0.16 ms, same look), and the sky is written only when a color really changed, and at most every 0.2 seconds during transitions:
sky.radiance_size = Sky.RADIANCE_SIZE_64   # default is 256

# every write re-renders the radiance map: skip it if nothing changed
if sky.sky_top_color != p.top or sky.sky_horizon_color != p.hor:
    sky.sky_top_color = p.top
    sky.sky_horizon_color = p.hor
Grass: MultiMesh chunks and a 7-to-4 blade LOD
The meadow holds 39,000 grass clumps. Putting them all in one MultiMesh means drawing every one of them even when the camera looks at a single corner. Instead, grass.gd splits the area into 12.5-meter squares, each its own MultiMesh, so the camera skips squares it cannot see. When the terrain changes, only a few small squares are re-uploaded.
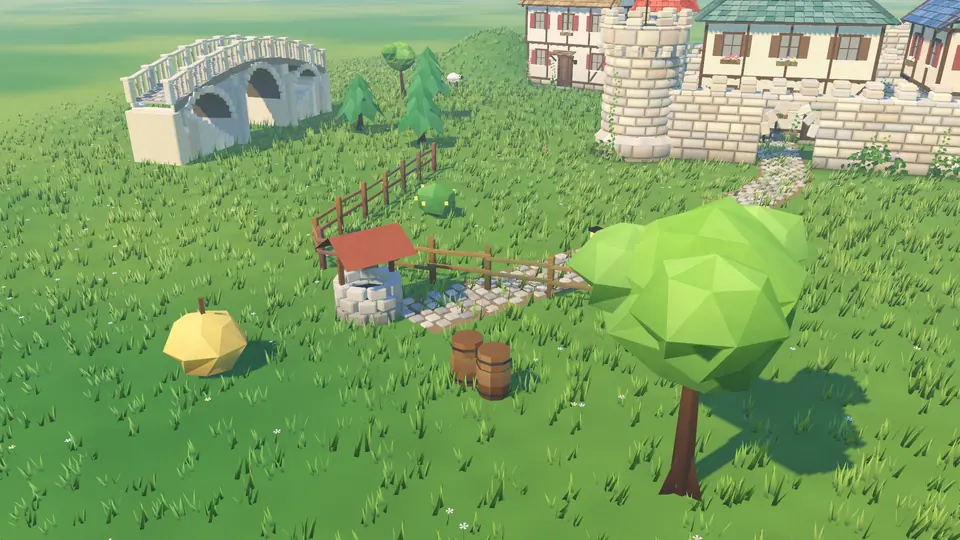
The meadow’s grass is made of 12.5-meter MultiMesh chunks.
Each square has two MultiMeshes over the same clumps: 7-blade clumps up close and 4 wider blades beyond 55 meters. A tuft a few pixels tall looks the same either way, and the far mesh has about 40% fewer triangles. Godot's visibility ranges handle the switch:
const CHUNK := 12.5   # meters
const LOD_M := 55.0   # beyond this, the 4-blade clump

if li == 0:   # near mesh: 7 blades
    mmi.visibility_range_end = LOD_M
    mmi.visibility_range_end_margin = 5.0
else:         # far mesh: 4 wide blades
    mmi.visibility_range_begin = LOD_M
    mmi.visibility_range_begin_margin = 5.0
mmi.cast_shadow = GeometryInstance3D.SHADOW_CASTING_SETTING_OFF
The update that runs after each stroke was heavy as well. Every stroke re-seated every clump on the ground, which took 26 ms in a big village. Now only the clumps inside the changed rectangle of the heightmap are re-seated: 0.46 ms. A similar job for ponds went from 14 ms to 0.12 ms, and the whole post-stroke update fell from 64 ms to 18.6 ms.
The grass also produced an instructive bug. In GDScript, packed arrays such as PackedFloat32Array are value types. If you take one out of a dictionary, append to it and do not store it back, the change is lost:
var cell: PackedFloat32Array = cells.get(key, PackedFloat32Array())
cell.append_array([...])
cells[key] = cell   # without this, the append went to a copy
At one point this left 46 grass chunks empty. How it was spotted is worth mentioning: the store screenshots came out with bare ground.
Walls: 4-meter chunks and worker threads
I cover how the walls are generated in the procedural walls, gates and bridges post; this section is only about cost. In the first version, the whole wall was rebuilt every time the finger moved. On a 50-meter wall that took 80 ms, a visible hitch while drawing. The fix was to cut walls into 4-meter chunks and cache each one. While you draw, only the last 4 meters (the tail) are rebuilt. The result: a live wall update averages 8 ms, 11 ms at worst. A tower takes about 7.5 ms, and finishing a stroke about 27 ms.
Big changes, meaning four or more chunks to build, go to WorkerThreadPool while the old picture stays on screen. There was a GDScript-specific trap here: when threads shared the same RefCounted object, they kept waiting on each other over its reference count. The fix is to hand each job its own copy of the path:
if jobs.size() >= ASYNC_MIN:   # ASYNC_MIN = 4; small jobs stay on the main thread
    for j: Job in jobs:
        if j.path != null:
            j.path = j.path.copy() as WallPath   # one copy per job: no shared refcount
    var id := WorkerThreadPool.add_group_task(_run_job.bind(jobs), jobs.size(), -1, true, "castle meshes")
To measure it, the agent wrote tools/bench_threads.gd: it builds a closed 56-meter wall as 14 jobs, first sequentially, then in the pool. Sequential runs landed anywhere between 354 and 2,158 ms, the pool between 141 and 164 ms. A spread that wide says the measurement is very noisy, so I will not claim an exact speedup. What it does show is that the pool is clearly faster and far more consistent.
Tried and dropped: automatic mesh LOD
Not every optimization paid off. The agent tried Godot's automatic LOD generation (ImporterMesh.generate_lods) for houses, towers and wall chunks: after a mesh was built, a low-priority worker simplified it and Godot picked a level based on on-screen error. Good idea on paper.
Measuring showed that the LODs never kicked in. The transitions started roughly 280 meters from the camera, and the game's camera never gets farther than 75 meters away. The system added work and lightened no frame at all, so it was removed. It is a good reminder not to accept an optimization until you have measured that it actually does something.
A short checklist
If your own mobile Godot project runs hot, check these in order:
- What frame rate is the game really running at? On a ProMotion iPhone, look at
allow_high_refresh_rate. - Is there a governor that lowers the frame rate while the scene is calm?
- Are the meshes in the shadow pass more detailed than they need to be? A plain stand-in is enough for a silhouette.
- Are thousands of instances (grass, trees) split into chunks, and do they switch to a lighter mesh in the distance?
- Is there a place where you write "the same value" every frame while the engine recomputes something expensive, like the sky?
- Does the optimization you added actually engage when you measure it?
The game is still in development: the App Store version is coming soon and the Android version is in preparation. You can find the current status and features on the Kalecik page. How the release side was automated is the subject of the App Store Connect API post.
Frequently Asked Questions
Why does a Godot game get hot on an iPhone?
The most common reason is a higher frame rate than the game needs. On ProMotion iPhones, Godot's iOS export allows more than 60 Hz and allow_high_refresh_rate is on by default, so a game can run at 120 fps. Add GPU-heavy work such as detailed shadows and grass with thousands of instances, and the phone heats up quickly.
Does turning off 120 Hz make the game look worse?
In a fast, reaction-heavy game you may feel the difference. In a calm building game like Kalecik, 60 fps looks smooth, and dropping to 30 fps when nobody is touching the screen goes unnoticed. The choice depends on the genre, but either way the default should be a conscious decision.
Why does Godot show 0 GPU time with Metal?
In the Godot version used for this project, the Metal driver reported viewport GPU time as 0. To see real GPU time on the Mac, the game was run through MoltenVK with --rendering-driver vulkan --rendering-method mobile. Those M1 figures do not match the phone exactly, but they are enough to show which setting is expensive.
Do the millisecond figures in this post apply to the phone?
No, all of them were measured on an M1 Mac. For the phone, the game writes a log line every second and a script for recording power traces with Instruments was prepared, but at the time of writing no measurement from the phone had been recorded. The Mac figures show which change made a big difference, not the exact value on the phone.
Related Posts
Procedural Stone Walls, Gates and Bridges in Godot
How a finger stroke in Kalecik becomes a stone wall, an arched gate, a bridge or a house: smoothing, seeded masonry and chunked meshes in Godot 4.
Building a Mobile Game with AI Agents: Kalecik
From an empty folder to an iPhone: how I made Kalecik by directing five parallel Claude Code sessions, what I decided myself, and where we hit walls.
Automating App Store Connect Release Prep with the API
How Kalecik's App Store prep runs on the API: a JWT, a price schedule, listings in 50 locales, engine-rendered screenshots and a one-command upload.